FHQ is guiltier than most of digging down into that chase or the rules governing the allocation of those delegates. However, taking a step back to gain a broader view of the undulations in the process can be just as important.
Compared to the frontloaded calendars of four and eight years ago, the 2016 calendar is completely different. The February start to the 2016 process is a month later than both of the previous cycles and most of the action is packed into just two months, March and April. Eight years ago, both parties had allocated more than 80% their delegates after the contests on the first Tuesday of March. At that same point on the calendar in 2012, roughly one-third of the total number of delegates had been allocated.
In 2016?
For the current cycle, the first Tuesday in March will be the one-quarter point on the cumulative delegates allocated tally in both parties.
The national parties informally coordinated the later start and unlike 2012, actually got their way. But the allocation of delegates is also pushed into a smaller space on the 2016 calendar than was the case in 2012. The de facto national primary on February 5, 2008 when 23 Democratic and 21 Republican state voted was perhaps even more compressed than is the case in 2016.
But the development of the 2016 calendar is about the back end of the calendar as well. Four southern states -- Arkansas, Kentucky, North Carolina and Texas -- all moved from May dates in 2012 to dates in the first half of March 2016. It is the shifting of the delegates in those states along with the later start that has led to the compressed -- March and April -- calendar of events in 2016.
Whereas the middle 50 percent of the allocation -- between the 25 percent and 75 percent points on the calendar -- were bookended by early March and late May spots in 2012, in 2016 that middle 50 percent window in from early March to late April with a very quick ramping up of allocation between March 1 and March 15 on both parties' calendars. After March 15, the climb from the 50 percent point to the 75 percent point is much more gradual and even more subtle after that until a late flourish of allocation in early June to close the process out.
This has strategic implications. The remaining candidates -- those not winnowed by the February carve-out state contests -- have a quick burst of primaries and caucuses in the first two weeks of March. All of the active campaigns will want to develop any kind of a lead in the delegate count by then. Though the rules open up a bit on the Republican side with the closing of the proportionality window, there are limited winner-take-all states to take advantage of after that. That means that any delegate lead in either party will be difficult to close for those challenging to overtake the leader in the count at that 50 percent point.
That is because the states after the middle of March are mostly going to distribute their delegates to multiple candidates in various ways. Both catching up to a delegate leader and closing out a nomination become steeper climbs in such an environment.
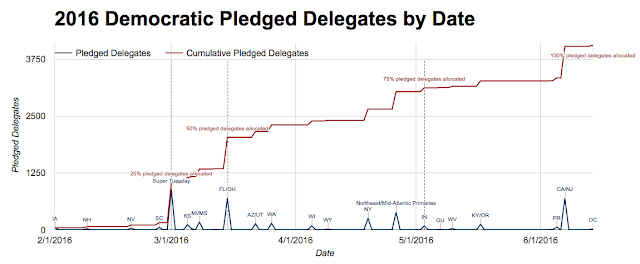
Below is a look at the how cumulative growth in delegates allocated progresses in both parties in 2016.
Of note is that the Democrats are about a week behind the Republican allocation after March 1. That has much to do with there being a bevy of southern conservative states early in the process. Both parties have some form of bonus delegate calculation that that rewards party loyalty (as measured by past voting history). There are more Republican bonuses up front than on the Democratic side. Those states carry more weight in the Republican process than for the Democrats.
Note also that there are two figures for the Democrats. The first accounts for the cumulative allocation of all of the Democratic delegates. However, that includes superdelegates that will not be pledged to candidates based on the results of primaries and caucuses. When the 712 superdelegates are backed out -- see the final figure -- the picture looks largely the same among the 4051 pledged delegates. The pattern is virtually the same.
--
The Republicans
Click Image to Enlarge
You can also find this image included with the delegate allocation information for the Republican process.
--
The Democrats
Click Image to Enlarge
Click Image to Enlarge


No comments:
Post a Comment